Oracle Tuning - ASH Architecture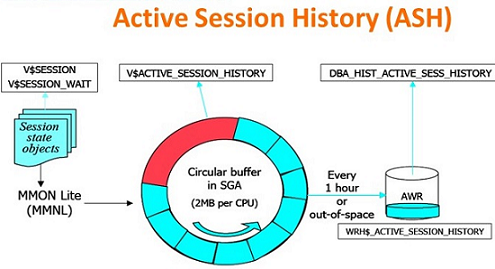 ASH introduced in 10g. Its part of the Diagnostics and Tuning Pack. Database performance monitor by statspack, AWR, ADDM and SQL Trace. They are gathering wait event information, but they observing past time. The v$dynamic view allow to see current and historical information of active sessions. You usually concentrate on a few important aspects while examining an Active Session History (ASH) report in order to comprehend how well your Oracle Database instance is doing. The following are the primary areas that an ASH report could look at: Create an AWR Report : Because ASH data is frequently integrated into AWR reports, you usually need to create an AWR report before creating an ASH report. To create an AWR report, use the awrinfo.sql script. Usually, you may find this script in the $ORACLE_HOME/rdbms/admin directory. @$ORACLE_HOME/rdbms/admin/awrinfo.sql : Determine Snapshot IDs: You will receive snapshot IDs from the AWR report that correspond to various times. Make a note of the snapshot IDs for the duration you wish to examine. Create ASH Report: To create an ASH report for the given snapshot IDs, use the ashrpt.sql script. You can find this script in the $ORACLE_HOME/rdbms/admin directory as well. @$ORACLE_HOME/rdbms/admin/ashrpt.sql : Interpret the Report: Examine the ASH report after it has been prepared to assess how well your Oracle Database instance is doing. To find performance bottlenecks and areas for improvement, pay close attention to important indicators including the most frequently used SQL statements, wait events, CPU utilization, and session activity. As an alternative, you can directly query the ASH data from the V$ACTIVE_SESSION_HISTORY view using custom SQL queries, and you can create custom reports according to your own needs.
    SQL> @$ORACLE_HOME/rdbms/admin/awrinfo.sql;

    This script will report general AWR information
    specify the Report File Name
    The default report file name is awrinfo.txt.  To use this name,
    press < return > to continue, otherwise enter an alternative.
    Enter value for report_name: ash.html
    Using the report name ash.html
    No errors.
    No errors.
    ~~~~~~~~~~~~~~~
    AWR INFO Report
    ~~~~~~~~~~~~~~~
    Report generated at
    07:18:38 on Feb 16, 2024 ( Friday ) in Timezone +05:30
    Warning: Non Default AWR Setting!
    --------------------------------------------------------------------------------
    Snapshot interval is 10 minutes and Retention is 30 days
    DB_ID           DB_NAME   HOST_PLATFORM    INST STARTUP_TIME    LAST_ASH_SID        RAC      VERSION
    4176617848      DEV       tesdba.localdomain - Linux x86 64-bit 1 07:17:34 (02/16)  0        NO     12.2.0.1.0

    Create ASH Report
    SQL> @?/rdbms/admin/ashrpt;
    Specify the Report Type
    ~~~~~~~~~~~~~~~~~~~~~~~
    Enter 'html' for an HTML report, or 'text' for plain text
    Defaults to 'html'
    Enter value for report_type: html
    Type Specified:  html
    Enter value for begin_time: 02/16/2024 07:20:00
    Enter value for duration: 10
    Using 16-Feb-24 07:20:00 as report begin time
    Using 16-Feb-24 07:25:19 as report end time
    --     1 minute,  if the source is V$ACTIVE_SESSION_HISTORY or
    --     5 minutes, if the source is AWR_(PDB/ROOT)_ACTIVE_SESS_HISTORY.
    Specify the Report Name
    The default report file name is ashrpt_1_0216_0725.html.  To use this name,
    press < return > to continue, otherwise enter an alternative.
    Enter value for report_name: sample.html
    Using the report name sample.html
    Summary of All User Input
    -------------------------
    Format	       : HTML
    DB Id	       : 4176617848
    Inst num       : 1
    Begin time     : 16-Feb-24 07:20:00
    End time       : 16-Feb-24 07:25:19
    Slot width     : Default
    Report targets : 0
    Report name    : sample.html
    End of Report
    < /body >< /html >
    Report written to sample.html
V$ACTIVE_SESSION_HISTROY (15 mins) :
    SQL> select NVL(a.event, 'ON CPU') as event, count(*) as total_wait_time from v$active_session_history a
         Where a.sample_time > sysdate - 15/(24*60) group by a.event  order by total_wait_time desc;

            EVENT                       TOTAL_WAIT_TIME
  ---------------------------         ----------------------
    ON CPU                                          393
    oracle thread bootstrap 			     10
    control file parallel write			      3
    db file async I/O submit			      2
    db file sequential read 			      1
DBA_HIST_ACTIVE_SESS_HISTORY :
    select NVL(a.event, 'ON CPU') as event, count(*)*20 as total_wait_time  from dba_hist_active_sess_history a
    where a.sample_time > sysdate - 1 group by a.event  order by total_wait_time desc;

            EVENT                       TOTAL_WAIT_TIME
    ---------------------------     ----------------------
    ON CPU                                          4660
    control file parallel write			     180
    oracle thread bootstrap 			     100
    external table read                               80
    db file sequential read 			      40
    db file async I/O submit			      40
    flashback log file write			      20
    cursor: pin S wait on X 			      20
    ADR block file read                               20
« Previous Next Topic » (Oracle Tuning - Identifying Long running SQLs for a time period) |